
New company incorporations in Cambridge
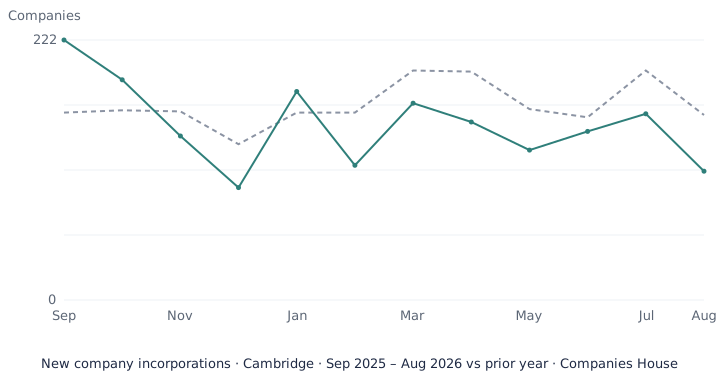
In the 12 months to August 2026, Companies House records in this analysis show 1,800 new companies with a registered office in Cambridge. Compared with the previous 12 months, the count decreased. A registered office in Cambridge is where a company is registered, not necessarily where it trades, and an incorporation is not a confirmed trading business.
The latest 12 months (solid) over the previous 12 (dashed). A month counting fewer than 10 companies is withheld and shown as a gap, never a zero.
| Month | 2024–25 | 2025–26 |
|---|---|---|
| Sep | 160 | 222 |
| Oct | 162 | 188 |
| Nov | 161 | 140 |
| Dec | 133 | 96 |
| Jan | 160 | 178 |
| Feb | 160 | 115 |
| Mar | 196 | 168 |
| Apr | 195 | 152 |
| May | 163 | 128 |
| Jun | 156 | 144 |
| Jul | 196 | 159 |
| Aug | 158 | 110 |
| Industry | Previous 12 months | Companies | Change | Share of area |
|---|---|---|---|---|
| Manufacturing | 356 | 532 | ▲ 49.4% | 29.6% |
| Retail and e-commerce | 354 | 246 | ▼ 30.5% | 13.7% |
| Software and IT services | 280 | 227 | ▼ 18.9% | 12.6% |
| Property and real estate | 122 | 104 | ▼ 14.8% | 5.8% |
| Management consultancy | 96 | 94 | ▼ 2.1% | 5.2% |
| Construction and trades | 77 | 92 | ▲ 19.5% | 5.1% |
| Hospitality and food services | 88 | 86 | ▼ 2.3% | 4.8% |
| Marketing, advertising and design | 86 | 50 | ▼ 41.9% | 2.8% |
| Health and social care | 55 | 41 | ▼ 25.4% | 2.3% |
| Transport, courier and logistics | 31 | 25 | ▼ 19.4% | 1.4% |
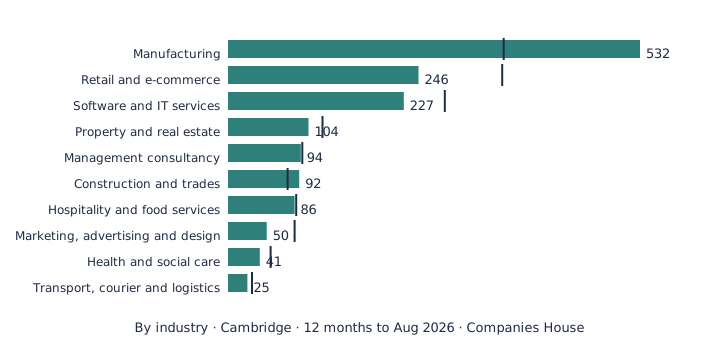
A company is counted in a group if any of its filed SIC codes falls in that group, so a company can appear in more than one group and these figures are not additive — they are not a breakdown of a whole. A filed SIC code records the activity declared at incorporation, not proof of current trading.
A large share of registrations sit at very few addresses
The single most-used registered-office address accounts for 21.4% of registrations in this area, and the ten most-used for 46.9%. That usually reflects an accountant, formation agent or virtual-office address rather than unusual local activity — so “companies registered here” and “businesses operating here” are materially different claims for this area.
Address concentration is published as a share and a distinct-address count only; no address is shown. A registered-office address is taken from the record at extraction and may differ from the address at the time of incorporation.
- Boundary
- Cambridge non-metropolitan district
- Geography code
- E07000008 (GSS), under geography version lr-geography-v1. Matching is by official code, never by text on the address.
- Postcode mapping
- The registered-office postcode is mapped to a local authority through the ONS Postcode Directory. Postcodes that cannot be mapped are counted separately, never reassigned to a neighbouring authority.
- Not included
- Cambridge city only. South Cambridgeshire — which contains much of the science-park belt, including Cambourne and Granta Park — is a separate authority and is not counted here.
- Registered office
- The address recorded at Companies House when the record was captured. It is not a verified trading location, an operational base or a founder's home.
- Incorporation
- A registration event. It is not evidence the company is trading, and it is not a business birth in the ONS sense.
- Historical addresses
- For backfilled months, the address is the one shown at extraction, which may differ from the address filed at incorporation.
- SIC codes
- Self-classified by the company at filing. A filed code is how the company described itself, not proof of current activity.
Launch Register analysis of Companies House public data: private limited companies incorporated with a registered office in Cambridge in the 12 months to August 2026, geography mapped using the ONS Postcode Directory. Pages update in place, so quoting the release month keeps a figure reproducible.
https://launchregister.co.uk/company-statistics/locations/cambridge/ · Data through August 2026 · Last updated 2026-09-18 · Coverage 2024-09/2026-08 · Methodology methodology-v1 · Geography lr-geography-v1 · Industry mapping sic2007-lr-v1
Download the data


- All local authorities
- All industries
- How these figures are produced
- New company statistics: Manufacturing
- New company statistics: Retail and e-commerce
- New company statistics: Software and IT services
- Companies House data for accountants
- SIC codes explained for UK accountants
Prospecting newly formed companies in Cambridge?
See the companies behind these figures — a personalised sample for your area and sectors.
Personalised sample of up to 10 companies · no card required · £29/month to continue