
New company statistics: Health and social care
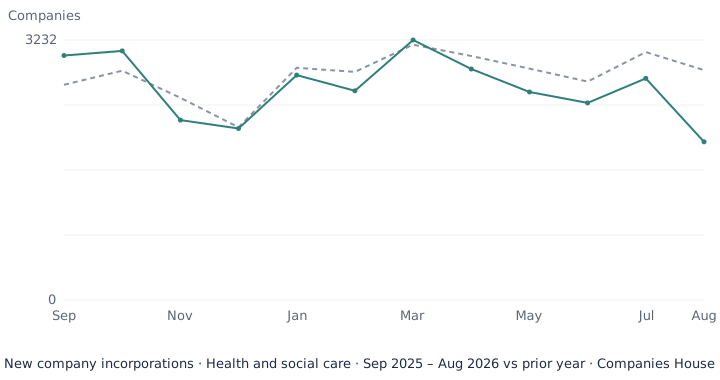
In the 12 months to August 2026, Companies House records in this analysis show 31,759 new companies incorporated in the Health and social care group. Companies House records in this analysis show that the number of new companies decreased within the stated period. The data does not establish why the count changed.
A company is counted here if any of its filed SIC codes falls in this group, so a company can appear in more than one group and these figures are not a UK total for the sector.
| Month | 2024–25 | 2025–26 |
|---|---|---|
| Sep | 2,675 | 3,039 |
| Oct | 2,850 | 3,096 |
| Nov | 2,514 | 2,236 |
| Dec | 2,147 | 2,132 |
| Jan | 2,887 | 2,796 |
| Feb | 2,835 | 2,600 |
| Mar | 3,174 | 3,232 |
| Apr | 3,033 | 2,871 |
| May | 2,877 | 2,586 |
| Jun | 2,715 | 2,450 |
| Jul | 3,081 | 2,755 |
| Aug | 2,858 | 1,966 |
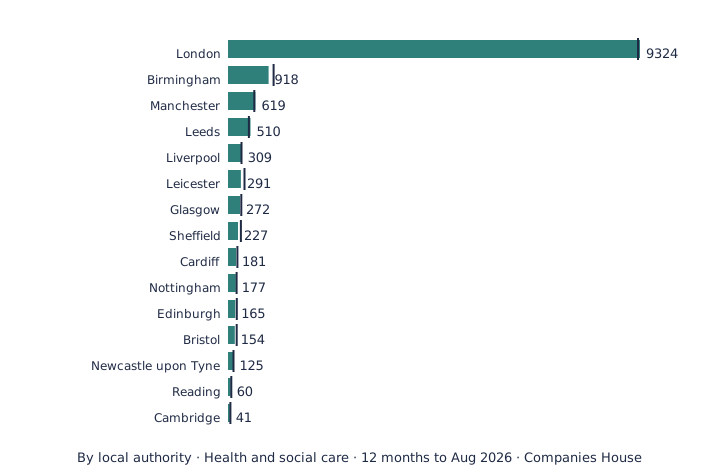
These are the places Launch Register publishes, ranked by companies in this group over the latest rolling 12 months. They are not every UK local authority, so they do not sum to the group's national total. A place counting fewer than ten companies in this group is not shown.
| Local authority | Companies | Change |
|---|---|---|
| London | 9,324 | ▲ 0.5% |
| Birmingham | 918 | ▼ 11.1% |
| Manchester | 619 | ▲ 3.9% |
| Leeds | 510 | ▲ 7.6% |
| Liverpool | 309 | ▲ 1.0% |
| Leicester | 291 | ▼ 22.0% |
| Glasgow | 272 | ▼ 9.3% |
| Sheffield | 227 | ▼ 22.5% |
| Cardiff | 181 | ▼ 15.0% |
| Nottingham | 177 | ▼ 8.8% |
| Edinburgh | 165 | ▼ 17.1% |
| Bristol | 154 | ▼ 21.8% |
| Newcastle upon Tyne | 125 | ▲ 0.8% |
| Reading | 60 | ▼ 18.9% |
| Cambridge | 41 | ▼ 25.4% |
Each row counts companies that filed the exact code over the latest rolling 12 months. A company filing more than one of the group's codes is counted under each, so these do not add up to the group total. A code counting fewer than ten companies is not listed.
| SIC code | Description | Companies |
|---|---|---|
| 86900 | Other human health activities | 13,767 |
| 86220 | Specialists medical practice activities | 4,453 |
| 86210 | General medical practice activities | 3,065 |
| 87900 | Other residential care activities n.e.c. | 2,878 |
| 86230 | Dental practice activities | 2,383 |
| 88990 | Other social work activities without accommodation n.e.c. | 2,113 |
| 87200 | Residential care activities for learning difficulties, mental health and substance abuse | 2,022 |
| 88100 | Social work activities without accommodation for the elderly and disabled | 1,892 |
| 88910 | Child day-care activities | 1,803 |
| 87300 | Residential care activities for the elderly and disabled | 1,743 |
| 87100 | Residential nursing care facilities | 804 |
| 86101 | Hospital activities | 743 |
| 86102 | Medical nursing home activities | 510 |
How this group is defined
This group follows the official SIC 2007 structure (Official SIC 2007 divisions 86–88). All of SIC 2007 divisions 86–88 — human health (hospital, medical and dental practice), residential care, and social work. These are self-declared classifications: a filed code is not evidence of professional or regulatory registration, for example with the CQC or GMC.
The mapping is published as version sic2007-lr-v1, with all 13 five-digit codes listed below, so this analysis can be reproduced rather than taken on trust. The full mapping, and how dormant, non-trading and unfiled codes are treated, is in the methodology; the guide to SIC codes explains what these codes mean.
The 13 SIC 2007 codes in this group (sic2007-lr-v1)
86101, 86102, 86210, 86220, 86230, 86900, 87100, 87200, 87300, 87900, 88100, 88910, 88990
- Multiple SIC codes
- A company may file up to four codes and can appear in more than one broad group. Group totals are not additive, and the UK share is calculated on that basis.
- Self-classification
- SIC codes are chosen by the company at filing. A filed code is not verification that the company does that activity, or is trading at all.
- No “primary” code
- Companies House does not designate one filed code as primary, so neither do we.
- Regulation
- A health or social-care SIC code is not evidence of registration with a professional or sector regulator, for example the CQC or the GMC.
Launch Register analysis of Companies House public data: private limited companies with a filed SIC code in the Health and social care group (sic2007-lr-v1), incorporated in the 12 months to August 2026.
https://launchregister.co.uk/company-statistics/industries/health-and-social-care/ · Data through August 2026 · Last updated 2026-09-18 · Coverage 2024-09/2026-08 · Methodology methodology-v1 · Industry mapping sic2007-lr-v1
Download the data


Related analysis
Track new companies in your area
Launch Register turns this public data into a weekly list of newly formed companies matching your industry and location filters.
Personalised sample of up to 10 companies · no card required · £29/month to continue